 |
GearBlocks
The GearBlocks Lua scripting API
|
|
GearBlocks
The GearBlocks Lua scripting API
|
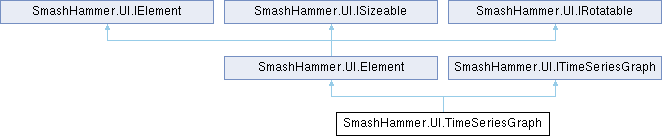
A time series graph UI element. More...
Public Member Functions | |
| int | CreateTimeSeries (Color32Proxy colour, float lineThickness=1.0f) |
| Add a new time series to the graph. | |
| void | DestroyAllTimeSeries () |
| Destroy all previously created time series, removing them from the graph. | |
| void | SetMinMax (float minValue, float maxValue) |
| Set the minimum and maximum values used to scale the graph's y axis. After calling this, auto scaling is disabled, and any values outside the range will be clamped. | |
| void | ResetMinMax () |
| Reset back to zero the minimum and maximum values used to scale the graph's y axis. | |
| void | AddDataPoint (int index, float value) |
| Add a data point to a currently existing time series. | |
| void | ClearData (int index) |
| Clear all data points from a currently existing time series. | |
| void | SetVisible (int index, bool visible) |
| Show / hide a time series. | |
| void | ResetAll () |
| Clear data from all currently existing time series. | |
| void | SetAlignment (Align align, float paramA, float paramB) |
| Set the element's alignment. | |
| void | SetRotation (float angle) |
| Set the element's rotation. | |
| int | CreateTimeSeries (Color32Proxy colour, float lineThickness=1.0f) |
| Add a new time series to the graph. | |
| void | DestroyAllTimeSeries () |
| Destroy all previously created time series, removing them from the graph. | |
| void | SetMinMax (float minValue, float maxValue) |
| Set the minimum and maximum values used to scale the graph's y axis. After calling this, auto scaling is disabled, and any values outside the range will be clamped. | |
| void | ResetMinMax () |
| Reset back to zero the minimum and maximum values used to scale the graph's y axis. | |
| void | AddDataPoint (int index, float value) |
| Add a data point to a currently existing time series. | |
| void | ClearData (int index) |
| Clear all data points from a currently existing time series. | |
| void | SetVisible (int index, bool visible) |
| Show / hide a time series. | |
| void | ResetAll () |
| Clear data from all currently existing time series. | |
Additional Inherited Members | |
 Public Types inherited from SmashHammer.UI.ISizeable Public Types inherited from SmashHammer.UI.ISizeable | |
| enum | Align : byte { LeftEdge , RightEdge , TopEdge , BottomEdge , HorizEdges , VertEdges , HorizCentre , VertCentre } |
| UI element alignment mode. More... | |
| Properties inherited from SmashHammer.UI.Element | |
| virtual bool | IsVisible [get, set] |
| Is the element visible? | |
| Properties inherited from SmashHammer.UI.IElement | |
| bool | IsVisible [get, set] |
| Is the element visible? | |
| bool | IsInteractable [get, set] |
| Is the element interactable? | |
| bool | IsTargetable [get, set] |
| Is the element targetable? | |
| Properties inherited from SmashHammer.UI.ITimeSeriesGraph | |
| float | TimeSpan [get, set] |
| The graph's time span. | |
| bool | AutoScale [get, set] |
| Automatically adjust the graph's y axis minimum and maximum values to fit the data? | |
| bool | ShowReferenceLines [get, set] |
| Show reference lines on the graph? | |
| float | ReferenceLineInterval [get, set] |
| The interval between reference lines. | |
| float | ReferenceLineThickness [get, set] |
| The reference line's thickness. | |
| Color32Proxy | ReferenceLineColour [get, set] |
| The reference line's colour. | |
| Color32Proxy | AxisLineColour [get, set] |
| The y = 0 reference line's colour. | |
A time series graph UI element.
| int SmashHammer.UI.TimeSeriesGraph.CreateTimeSeries | ( | Color32Proxy | colour, |
| float | lineThickness = 1.0f |
||
| ) |
Add a new time series to the graph.
| colour | The line colour to be used when plotting the time series. |
| lineThickness | The line thickness to be used when plotting the time series. |
Implements SmashHammer.UI.ITimeSeriesGraph.
| void SmashHammer.UI.TimeSeriesGraph.SetMinMax | ( | float | minValue, |
| float | maxValue | ||
| ) |
Set the minimum and maximum values used to scale the graph's y axis. After calling this, auto scaling is disabled, and any values outside the range will be clamped.
| minValue | Minimum y axis value. |
| maxValue | Maximum y axis value. |
Also see AutoScale.
Implements SmashHammer.UI.ITimeSeriesGraph.
| void SmashHammer.UI.TimeSeriesGraph.AddDataPoint | ( | int | index, |
| float | value | ||
| ) |
Add a data point to a currently existing time series.
| index | Index of the time series. |
| value | Value to add. |
The data point will be time stamped with the current game time when added.
Implements SmashHammer.UI.ITimeSeriesGraph.
| void SmashHammer.UI.TimeSeriesGraph.ClearData | ( | int | index | ) |
Clear all data points from a currently existing time series.
| index | Index of the time series. |
Implements SmashHammer.UI.ITimeSeriesGraph.
| void SmashHammer.UI.TimeSeriesGraph.SetVisible | ( | int | index, |
| bool | visible | ||
| ) |
Show / hide a time series.
| index | Index of the time series. |
Time series that are not visible don't contribute to y-axis auto scaling.
Implements SmashHammer.UI.ITimeSeriesGraph.
 1.9.7
1.9.7